

What's New at GTC
- On this day2017 — MARIA peaked at 150kt (C5)
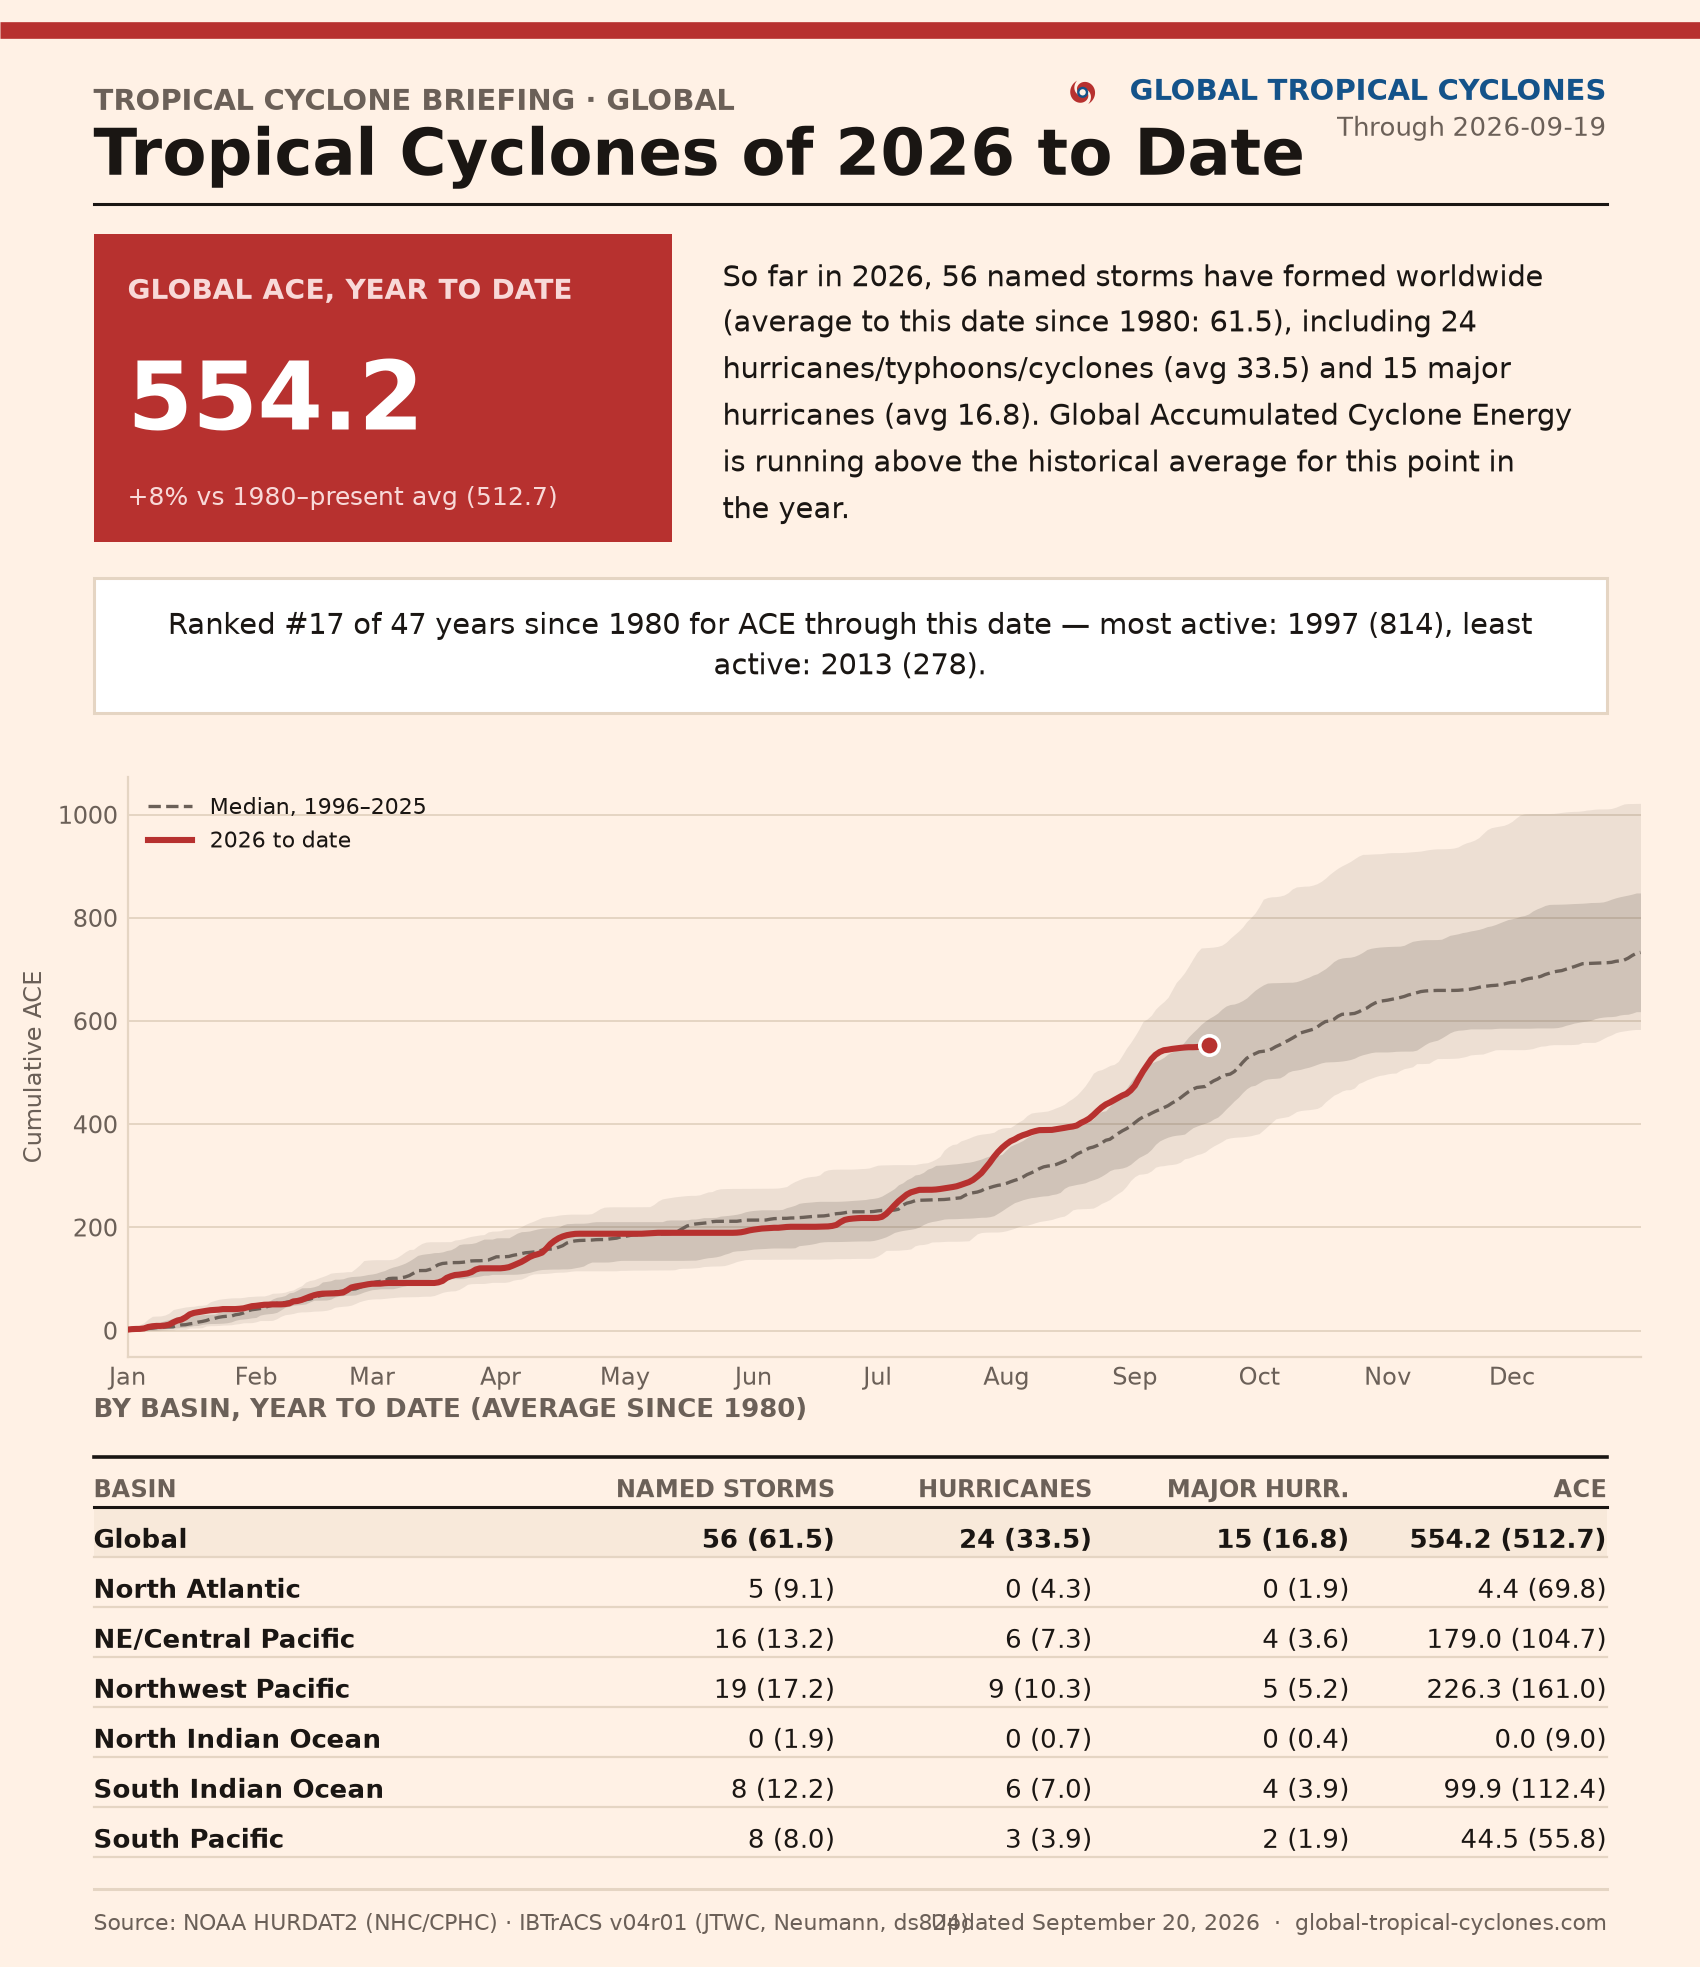
- Global ACE2026 year-to-date: 554.2 ACE, +8% vs the 1980–present average (512.7)
- NATL ACE2026 year-to-date: 4.4 ACE, -94% vs the 1980–present average (69.8)
- Daily BriefingTropical Cyclones of 2026 to DateUpdated 2026-09-19
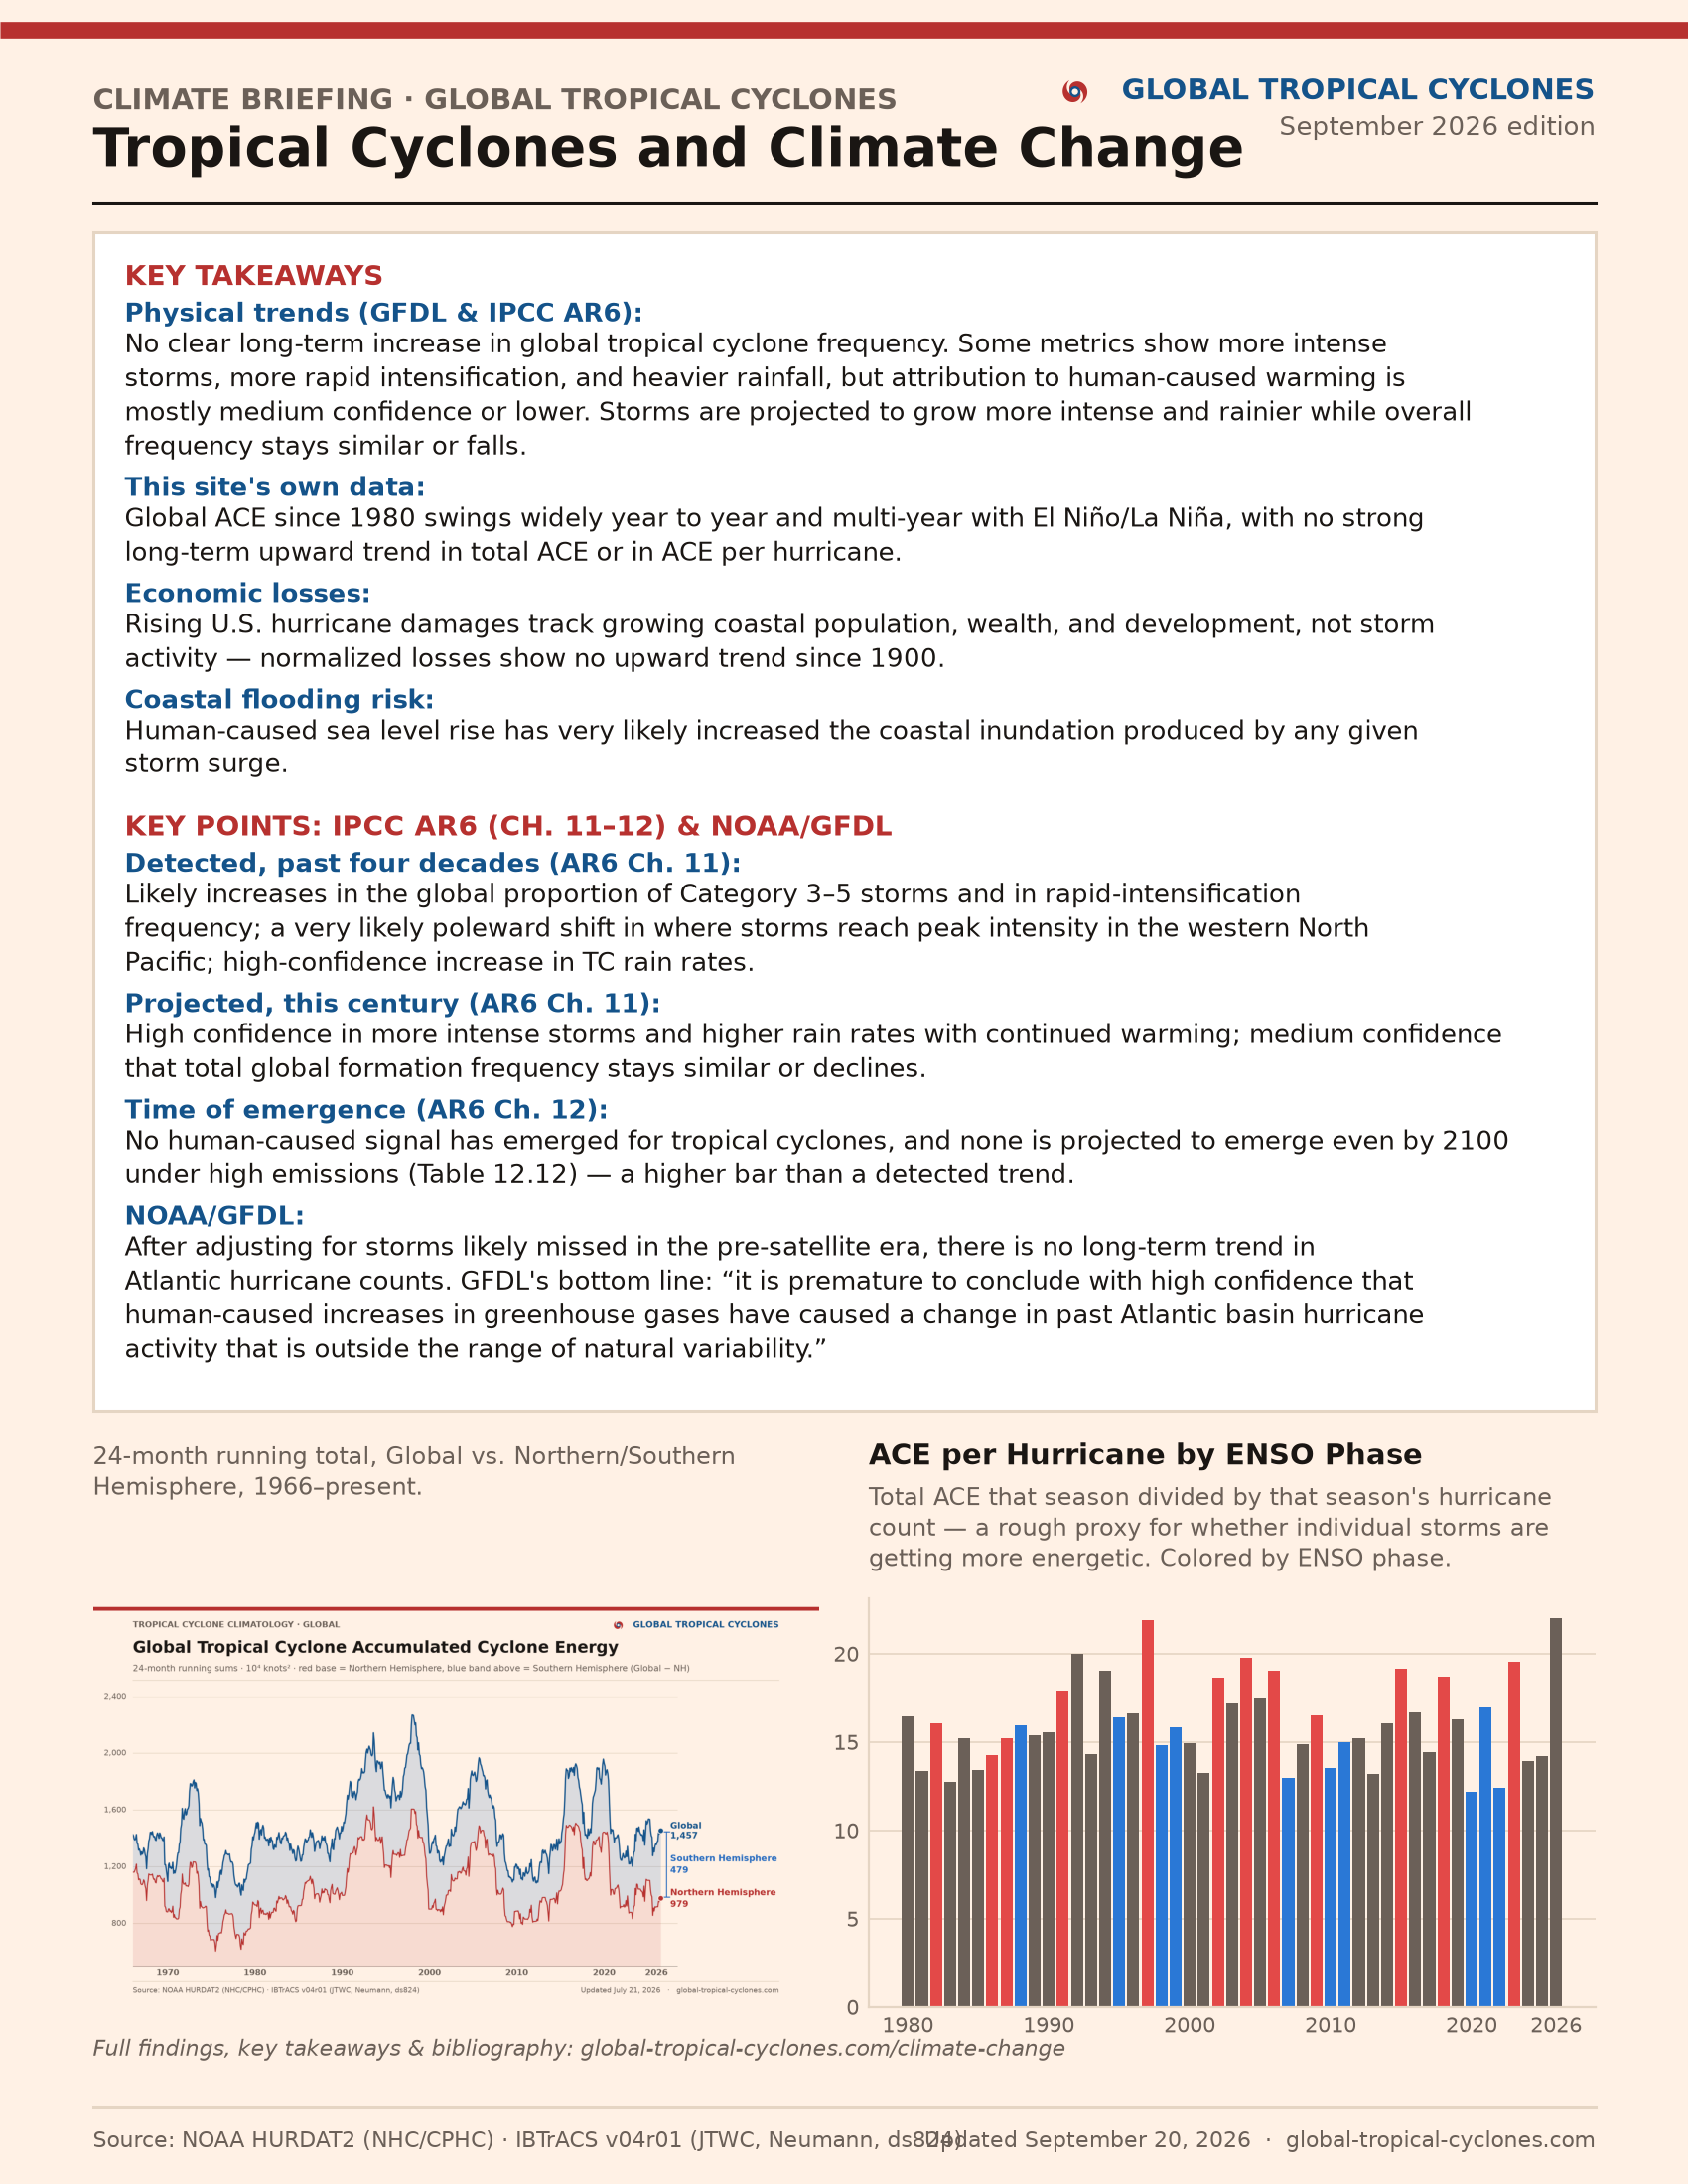
- Climate BriefingTropical Cyclones and Climate ChangeSeptember 2026 edition
2026 Year to Date — GlobalUpdated 2026-09-19
56 (61.5 - avg ytd)Named Storms
24 (33.5)Hurricanes
15 (16.8)Major Hurricanes
554.2 (512.7)ACE
ACE is calendar-year to date. The Global page's season total also counts the Southern Hemisphere's 2026 season back to mid-2025, so the two figures won't match.
2026 Year to Date — AtlanticUpdated 2026-09-19
5 (9.1 - avg ytd)Named Storms
0 (4.3)Hurricanes
0 (1.9)Major Hurricanes
4.4 (69.8)ACE
Briefings
Global Tropical Cyclones
Named storms, hurricane/typhoon/cyclone activity, and ACE across all basins, computed from the operational best tracks of NHC, CPHC, and JTWC.
Sum of all six basins. Coverage is uneven before ~1980 -- see Methodology. Full climatology charts and season-by-season tables for Global and every basin now live on their own pages — pick one from the basin menu above, or jump straight to Global.
Running Totals
Global · 1966–present, updated 2026-09-19 · each storm counted once, in the month of its first fix
Named Storms — 182Hurricanes — 90Major Hurricanes — 49